
Z Score Calculator
A z-score says how many standard deviations a value is from the mean — the common language for comparing scores from different tests, spotting outliers and reading the normal distribution. This calculator converts values to z-scores and percentiles, works backwards from a percentile to a value, and standardises a whole data set, showing the curve and the working.
- Free to use
- No sign-up
- Runs in your browser
Z-score calculator
Z-Score Statistics Pack
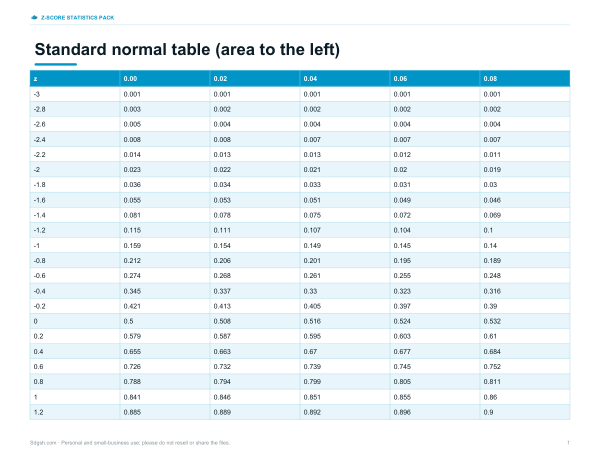
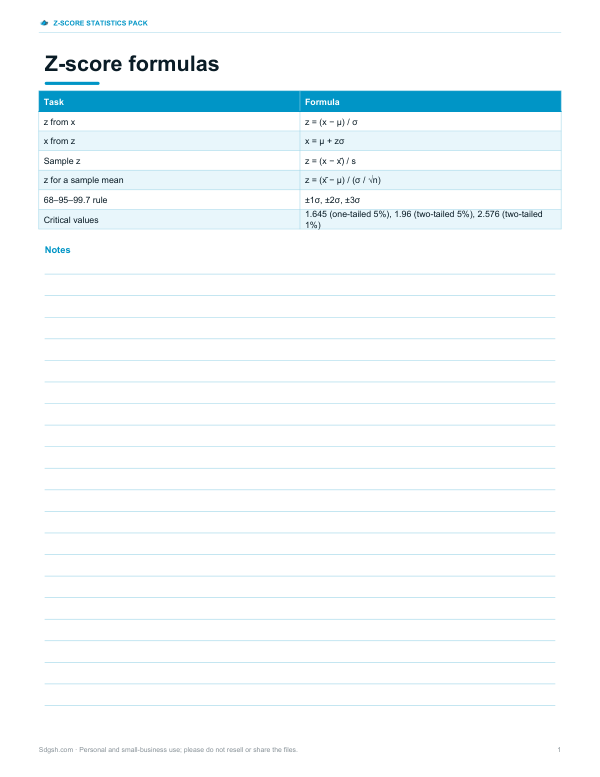
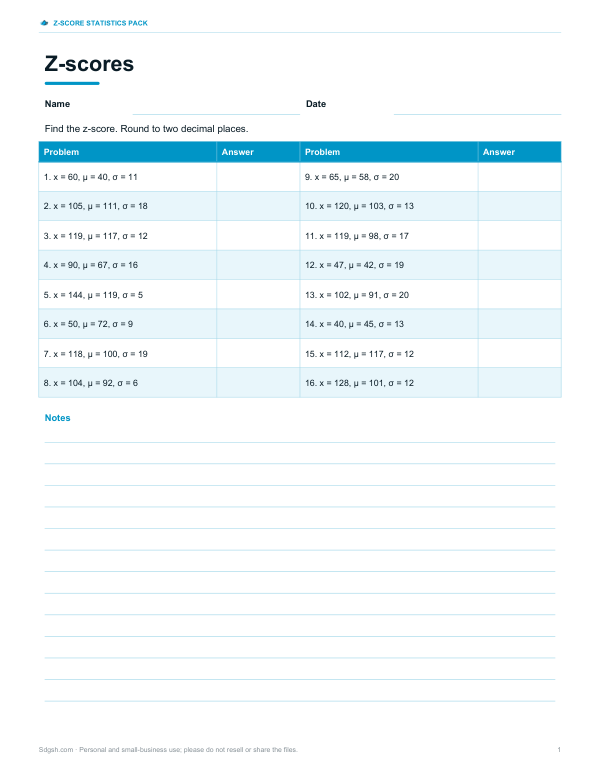
Printable statistics study sheets: standard normal (z) table, z-score formula card, practice worksheet with answer key and an Excel template that standardises a data set.
- Z table (PDF/XLSX)
- Formula card (PDF)
- Practice worksheet (PDF/DOCX)
- Standardise data (XLSX)
Formats: PDF, XLSX, DOCX. Instant download after payment (link valid 72 hours, up to 5 downloads). AI-assisted: the templates were drafted with AI help and reviewed and laid out before publishing.
$5.00 USD, one-time 4 files · about $1.25 each
- Instant download
- 7-day refund
- Secure checkout by Stripe
7-day money-back guarantee. Full refund within 7 days of purchase, even after you download.
Free sample: Standard Normal Table (PDF, 114 KB)
Full refund within 7 days — see the refund policy and license.
Free printables
Single sheets you can print right now, no sign-up. The full pack adds every sheet in one download plus the editable files.
 Z Score Standardisation Worksheet
The z-score formula
z = (x − μ) ÷ σ, where x is the value, μ the mean and σ the standard deviation. A z-score of 0 is exactly average; +1 is one standard deviation above; −2 is two below. Because z-scores remove the original units, they let you compare values from different scales — a test score out of 1600 and one out of 36 — on the same footing.
Z-scores and percentiles
| z | Percentile (area to the left) | Two-tailed p |
|---|---|---|
| -3 | 0.13% | 0.0026 |
| -2 | 2.28% | 0.0456 |
| -1.645 | 5% | 0.1000 |
| -1 | 15.87% | 0.3174 |
| 0 | 50% | 1.0000 |
| 1 | 84.13% | 0.3174 |
| 1.645 | 95% | 0.1000 |
| 1.96 | 97.5% | 0.0500 |
| 2 | 97.72% | 0.0456 |
| 2.576 | 99.5% | 0.0100 |
| 3 | 99.87% | 0.0026 |
These values come from the standard normal distribution. The calculator computes them with a standard high-accuracy approximation, so you don’t need a printed z-table.
The 68–95–99.7 rule
For normally distributed data, about 68% of values lie within one standard deviation of the mean, about 95% within two, and about 99.7% within three. That is why a z-score beyond ±2 is described as unusual and beyond ±3 as rare. Many real data sets are only roughly normal, so treat percentiles from z-scores as approximations when the data are skewed.
Worked example: comparing test scores
On a test with mean 1050 and standard deviation 200, a score of 1280 has z = (1280 − 1050) ÷ 200 = 1.15, which is about the 87.5th percentile. On a different test with mean 21 and standard deviation 5, a score of 27 has z = 1.2 — about the 88.5th percentile. Even though the raw scores look very different, the second performance is very slightly further above average. Working backwards, the 90th percentile on the first test is 1050 + 1.2816 × 200 ≈ 1306.
Sample or population standard deviation?
If your data are the whole population you care about, use the population standard deviation (dividing by n). If they are a sample used to estimate a larger population, use the sample standard deviation (dividing by n − 1), which is slightly larger. The data set mode shows both and uses the sample version for z-scores, as most statistics courses do.
Z-scores in hypothesis testing
In a z-test, the test statistic is a z-score, and the p-value is the probability of a result at least that extreme if the null hypothesis is true. For a two-tailed test at the 5% level, the critical values are ±1.96; for one-tailed, 1.645. The calculator shows one-tailed and two-tailed probabilities for any z. For small samples with an unknown population standard deviation, a t-test is usually more appropriate.
Reading a z-table
A standard normal table lists the area to the left of each z-score. To find the percentile for z = 1.15, go to the row for 1.1 and the column for 0.05: the entry, about 0.8749, means 87.49% of values fall below. For negative z-scores, use the negative rows, or use symmetry: the area left of −z equals the area right of +z. To go the other way, find the area in the body of the table and read off the z-score. The calculator does both directions instantly, and the pack includes a printable table for exams where calculators with statistics functions aren’t allowed.
Standardising a data set
Converting every value in a data set to a z-score is called standardisation. The standardised data have a mean of 0 and a standard deviation of 1, which makes variables measured in different units comparable — a common step before combining scores into an index or feeding data into some statistical and machine-learning methods. Standardising doesn’t change the shape of the distribution: skewed data stay skewed.
Z-scores vs percentiles vs T-scores
| Scale | Mean | Standard deviation | Example |
|---|---|---|---|
| z-score | 0 | 1 | z = 1.5 |
| T-score (psychometrics) | 50 | 10 | T = 65 |
| IQ-style scores | 100 | 15 | 122.5 |
| Percentile | — | — | 93rd percentile |
All of these are ways of expressing the same position within a normal distribution. Converting between them is simple: T = 50 + 10z and an IQ-style score = 100 + 15z. Percentiles are not evenly spaced — the difference between the 50th and 60th percentile is much smaller in z than between the 90th and 99th.
When z-scores can mislead
- Skewed data (such as incomes or waiting times) don’t follow the normal curve, so percentiles from z-scores can be wrong.
- Small samples give unstable estimates of the mean and standard deviation.
- Outliers inflate the standard deviation, which can hide other unusual values.
- Comparing z-scores from different populations assumes both are roughly normal.
For skewed data, consider percentiles computed directly from the data, or a transformation such as logarithms, before standardising.
Common uses
- Standardising test scores and grading on a curve.
- Growth charts for children (weight-for-age z-scores).
- Finding outliers in quality control and data cleaning.
- Bone density reports (T- and Z-scores).
- Finance: how unusual a return is compared with history.
Privacy
Calculations run in your browser; your data are not uploaded.
Frequently asked questions
How do you calculate a z-score?
Subtract the mean from the value and divide by the standard deviation.
What percentile is a z-score of 1?
About the 84th percentile.
What z-score is the 95th percentile?
About 1.645.
What does a negative z-score mean?
The value is below the mean.
What is a good z-score?
It depends on context; above 0 is above average, and beyond ±2 is unusual.
Is my data uploaded?
No. Everything stays in your browser.